Debugging Your Graphs
Sometimes the graphs you make will not work as expected and it will be necessary to track down the problem to fix it. There are several tools at your disposal when needing to debug your uScript graphs.
Preparing to Debug with uScript
Before you start debugging, there are a couple things you should know beforehand.
Debug Save Method
uScript allows you to save your graphs a few different ways. It is important that you use the "Save Debug" method to save graphs you wish to also debug. This is because some of the debug methods mentioned below will only work with the graph has been saved in this way.
uScript will add in some extra logic to the exported C# script files it makes to support some debugging features. These debugging features are stripped out for optimization when saved as "Release".
To save a graph with debugging enabled, you can:
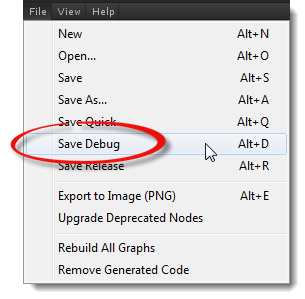
1. Select the Save Debug option from uScript's File menu (hot-key Alt+D):
2. Set the default Save Method in the Canvas menu to "Debug". This will ensure that whenever you just use "Save" through the File menu, or pressing the save button in the Graphs Panel, it will use the Debug option:

Using Unity's Console Window
Some of uScript's debug methods mentioned here (as well as other important information uScript may be telling you) use Unity's console window for text output. You should be familiar with its use and how to access it in order to take full advantage of the debug methods found below.
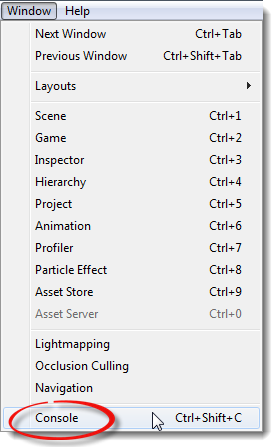
Unity's debug console can be opened by either left-clicking on bottom status bar of Unity's editor window, by using the Ctrl+Shift+C hot-key combo (use Cmd+Shift+C on Mac), or by choosing "Console" from Unity's Window menu.
Using Nodes To Debug
There are a few different ways to comment things in uScript. The function of these methods are to provide information to uScript users about important information regarding the graph logic and how it is used either for design time or runtime.
Comment Node
Clearly understanding how a graph has been setup and works is a great first line of defense from needing to debug a graph in the first place. One of the best ways to do this is by using Comment Nodes on your graphs.This is a special node that allows you to provide text information right on the uScript Canvas for your graphs. You can place as many of these as you wish and also customize its background and text colors. These nodes also are positioned "behind" all other nodes so you can also use them to "box in" nodes to help provide more visual context and sectioning of you graphs. This can help greatly for graph organization and readability-- especially on larger graphs.
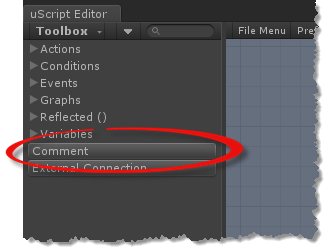
To place a Comment Node on a graph, you can select it from the top level of the Toolbox, or use the hot-key combo C+LeftMouseButton to place one at a specific location on the Canvas.
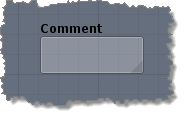
Once placed, you will see a default Comment Node appear on the canvas:
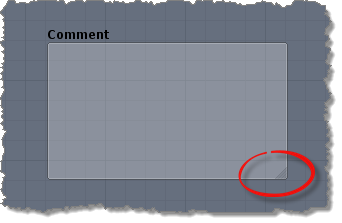
You can move it around like any other node by selecting it. The comment Node can also be resized. To do this, left-click on the resize handle at the lower right of the Comment Node and drag it out to the desired size:
You can edit the properties of the Comment Node by selecting it and editing the settings in uScript's Properties Panel:
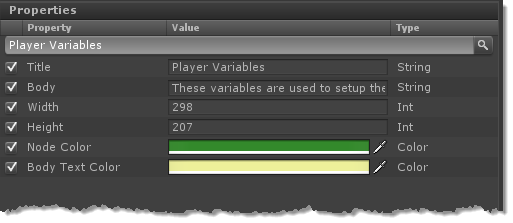
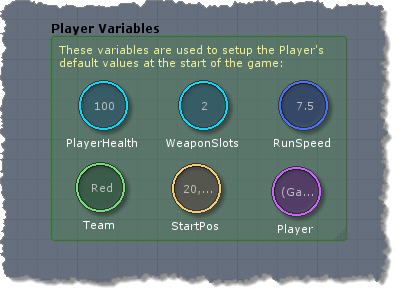
Here is an example of a Comment Node setup to hold a bunch of global variables for the player. Notice that "normal" nodes such as these variable nodes can be placed in front of the comment node:
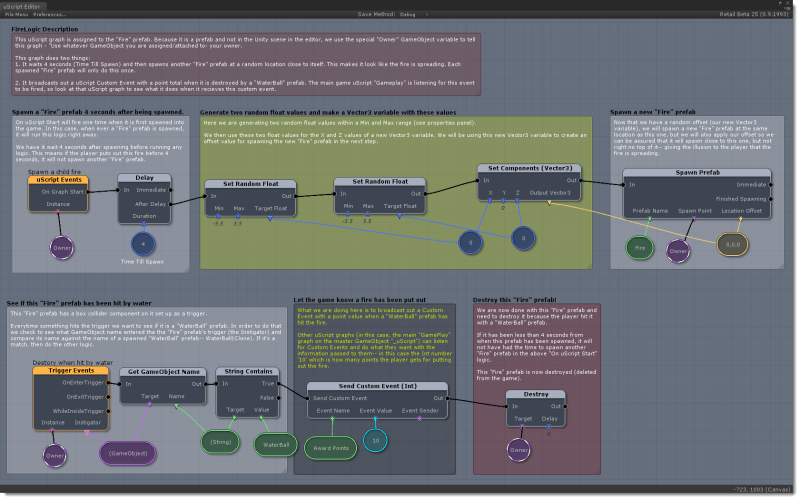
Here is a more complex example of a graph using several Comment Nodes to help explain the details of how the graph works:
Information Output
There are three fairly simple ways to output text that will allow you to see the values of variables or if specific logic is even executing at all.
Comment Property On Nodes
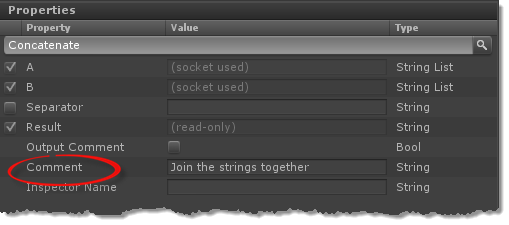
The comment property found on most nodes allows you to place a line of text directly above a node on the uScript Canvas. To enable this, you just need to provide text in the node's Comment property field in the Properties Panel:
_
Once this is done, the comment text will appear above the node on the graph:
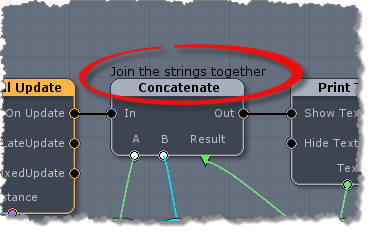
You can also have this comment print out to Unity's console window each time the node executes (receives a signal). To do this, simply check the node's "Output Comment" property in the Properties Panel and then make sure you are saving the graph using the "Save Debug" option (graphs saved as "Release" will not output debug comments to the console):
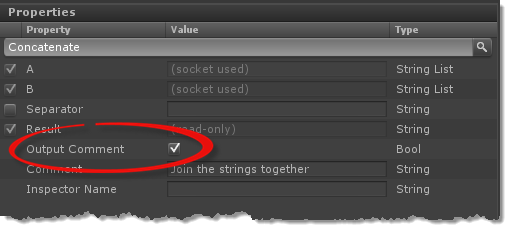
Once this is done, the comment will appear in the console window, also pricing information as to what graph and node type the comment came from:

Log Node
The first is to use the Log Node. This node allows you to output values to the console and uses Unity's
Debug.Log()script command.
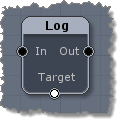
This node allows you to easily print out any variable type value and also to optionally include text before and after that value to Unity's console window.
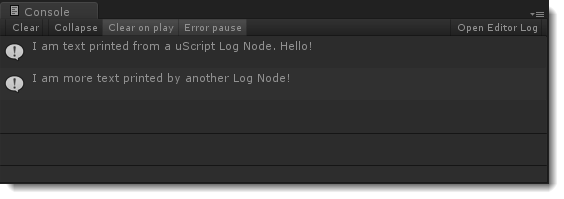
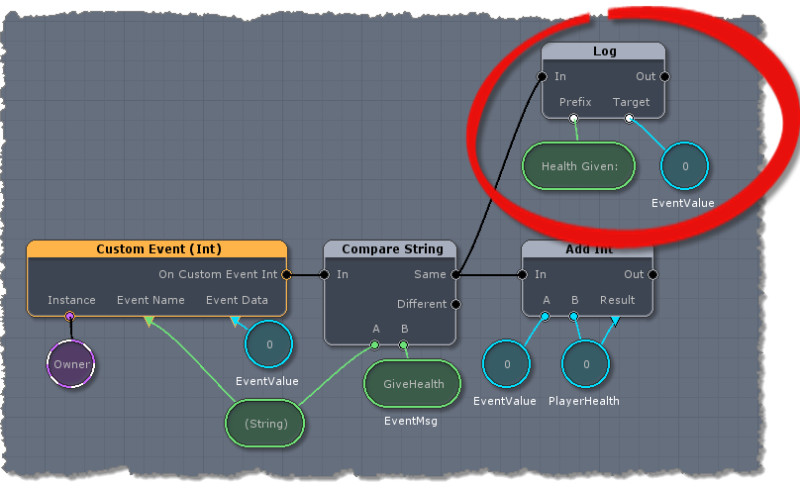
Here is a simple example of using a Log Node to print to the console whenever the player jumps. Notice how the debug logic is not inline with the other logic. This makes it easy to disconnect or remove once no longer needed.
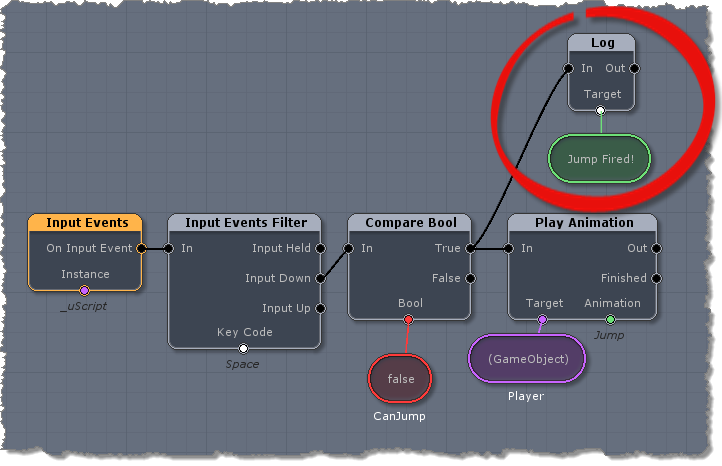
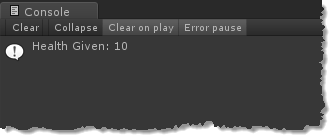
You can also use the Prefix or Postfix sockets to have text or other values appear before or after the Target value. This example shows adding some text before the value to better help the user find the console output text and also know what that value represents.
The resulting console output would look like this:
Print Text Node
If you would rather print text to the screen instead of Unity's console window, you can use the Print Text Node. This node is very useful when you are running your game on a target device where there is no Unity console to read output text (such as a mobile phone).
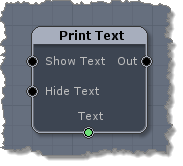
Once set up, this node will print text directly onto the game screen:
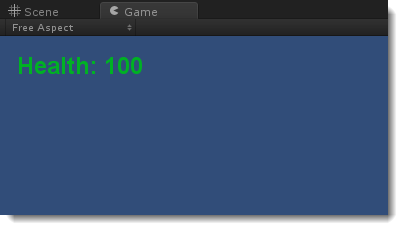
The above output was generated using the following graph logic. Please note that the Print Text Node's font style or properties will not be applied when running on mobile devices under Unity 3, as Unity 3 does not support that ability:
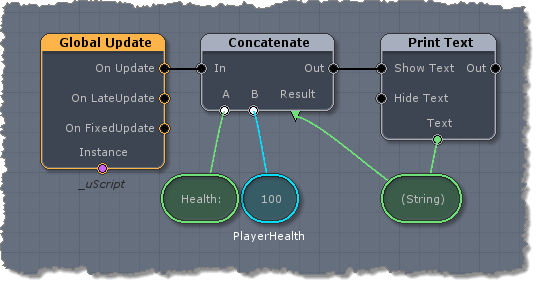
Note! - the Concatenate node is very useful to use with the Print Text Node because it allows you to input any variable type and to also provide extra text to the debug output (see the above example).
Other Nodes
There is also nothing stopping you from using other nodes to help with debugging. For example, you could play a certain sound with a Play Sound node based on logic you specify. Be creative and I'm sure you will think of others that could help you in special situations!
Visual Debugging
uScript Professional and uScript PLE has the ability to pause graph execution in the editor by setting breakpoints on nodes. When you do this, the game will pause execution when that node is about to fire, allowing you to review the state of variables on your graph and to also step through execution using Unity's pause/play system.
IMPORTANT! - The breakpoint debugging feature is only available in the Professional and Personal Learning Edition (PLE) versions of uScript. If you wish to upgrade your license of uScript Basic to the Professional version, please purchase an upgrade on the Unity Asset Store.
Note! - this system requires that you use the Debug Save option for the graph you wish to visually step debug.
Using Breakpoints
In uScript Professional and uScript PLE you can use breakpoints that you specify to tell uScript where to pause execution of graph logic while the game is running. You will need to re-save your graph (in Save Debug mode) when setting or removing breakpoints form nodes.
To set up a breakpoint on a node, simply right-click on the node and choose "Add Breakpoint" from the context menu:
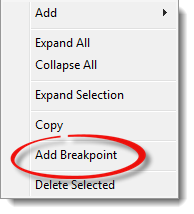
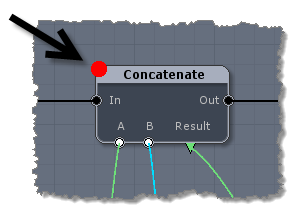
Once you do that you will see a red dot at the top left corner of the node. This let's you know there is an active breakpoint set on the node:
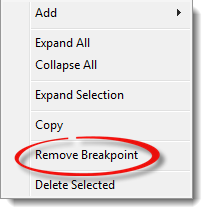
To remove an existing breakpoint from a node, just right-click the node again and choose "Remove Breakpoint" from the context menu:
Hitting A Breakpoint
When the game is running and a node with a breakpoint set on it is about to execute, the following things will happen:
1. uScript will pause the game's execution and change that node's breakpoint from a red dot to a larger yellow dot to show you what node the game is currently executing:
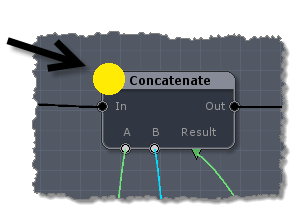
2. uScript will output to Unity's console window with information about which node caused the break:

3. Unity's Pause button in the editor will activate:
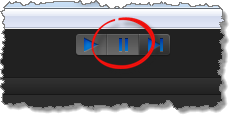
Once the game's execution has been paused, you can then either restart execution by pressing the Pause button again, or press the Step button to the right of the Pause button to step through the game manually. If you un-pause game execution, the game will pause again whenever another breakpoint is reached.
For more information on using Unity's Play Mode system, please see the Unity documentation.
Unity MonoDevelop Debugging
Lastly, because uScript generates C# source code, you could also use Unity's MonoDevelop debugging methods to directly debug the exported script code from uScript. Please see the Unity documentation for information on how to do this. Currently it can be found here: http://docs.unity3d.com/Documentation/Manual/Debugger.html
